![]()
If you have important production servers or critical services in your network, having monitoring tools becomes a must. In case of any hardware or software failures, it is crucial to get alerted as soon as possible and take appropriate actions to fix the failure.
In this article I would like to take a look at checkmk – a powerful monitoring software, developed by tribe29 GmbH with tons of configuration options and a user-friendly WebGUI, which can help you fully automate monitoring activities of your hardware and operating systems.
checkmk comes as a software bundle including underlying services like Apache, Nagios or Cron. In this article I am installing 1.6.0p7 raw edition from RPM package on CentOS 8.
Install checkmk server on CentOS 8 from RPM package
0. Prerequisites:
Configure firewall to allow access to HTTP server with checkmk WebGUI:
[root@chronos ~]# firewall-cmd --add-service http --permanent
success
[root@chronos ~]# firewall-cmd --reload
success
If you have SELinux enabled in Enforcing mode, allow HTTP server with checkmk WebGUI to connect to the network by means of enabling the below SELinux boolean variable (add -P parameter to make the boolean variable value persistent across reboots):
[root@chronos ~]# setsebool -P httpd_can_network_connect onInstall graphviz-gd package from PowerTools repo, needed by checkmk:
[root@chronos ~]# dnf --enablerepo=PowerTools install graphviz-gd1. Download checkmk RPM package:
[root@chronos ~]# wget https://checkmk.com/support/1.6.0p7/check-mk-raw-1.6.0p7-el8-38.x86_64.rpm2. Install downloaded checkmk RPM:
[root@chronos ~]# dnf localinstall check-mk-raw-1.6.0p7-el8-38.x86_64.rpm3. Create monitoring instance (as root) with your preferred name
[root@chronos ~]# omd create wcss
Adding /opt/omd/sites/wcss/tmp to /etc/fstab.
Creating temporary filesystem /omd/sites/wcss/tmp...OK
Restarting Apache...OK
Created new site wcss with version 1.6.0p7.cre.

  The site can be started with omd start wcss.
  The default web UI is available at http://chronos/wcss/

  The admin user for the web applications is cmkadmin with password: ugvR3qzw
  (It can be changed with 'htpasswd -m ~/etc/htpasswd cmkadmin' as site user.
)
  Please do a su - wcss for administration of this site.
Keep above admin credencials and WebGUI address info for your reference.
4. Launch the instance:
[root@chronos ~]# omd start wcss
Starting mkeventd...OK
Starting rrdcached...OK
Starting npcd...OK
Starting nagios...OK
Starting apache...OK
Initializing Crontab...OK
5. Test WebGUI access
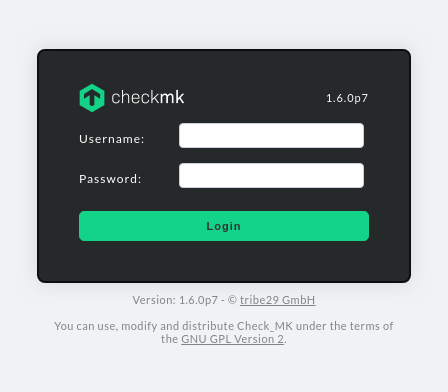
Now let’s check, if we are able to log in to the checkmk dashboard. Open checkmk WebGUI URL in your web browser:
http://check_mk-server-ip/wcss/Once you see checkmk login screen, use default credencials given in point 3 (cmkadmin / ugvR3qzw) to log in to the dashboard:
Example checkmk dashboard screen, right after logging in:
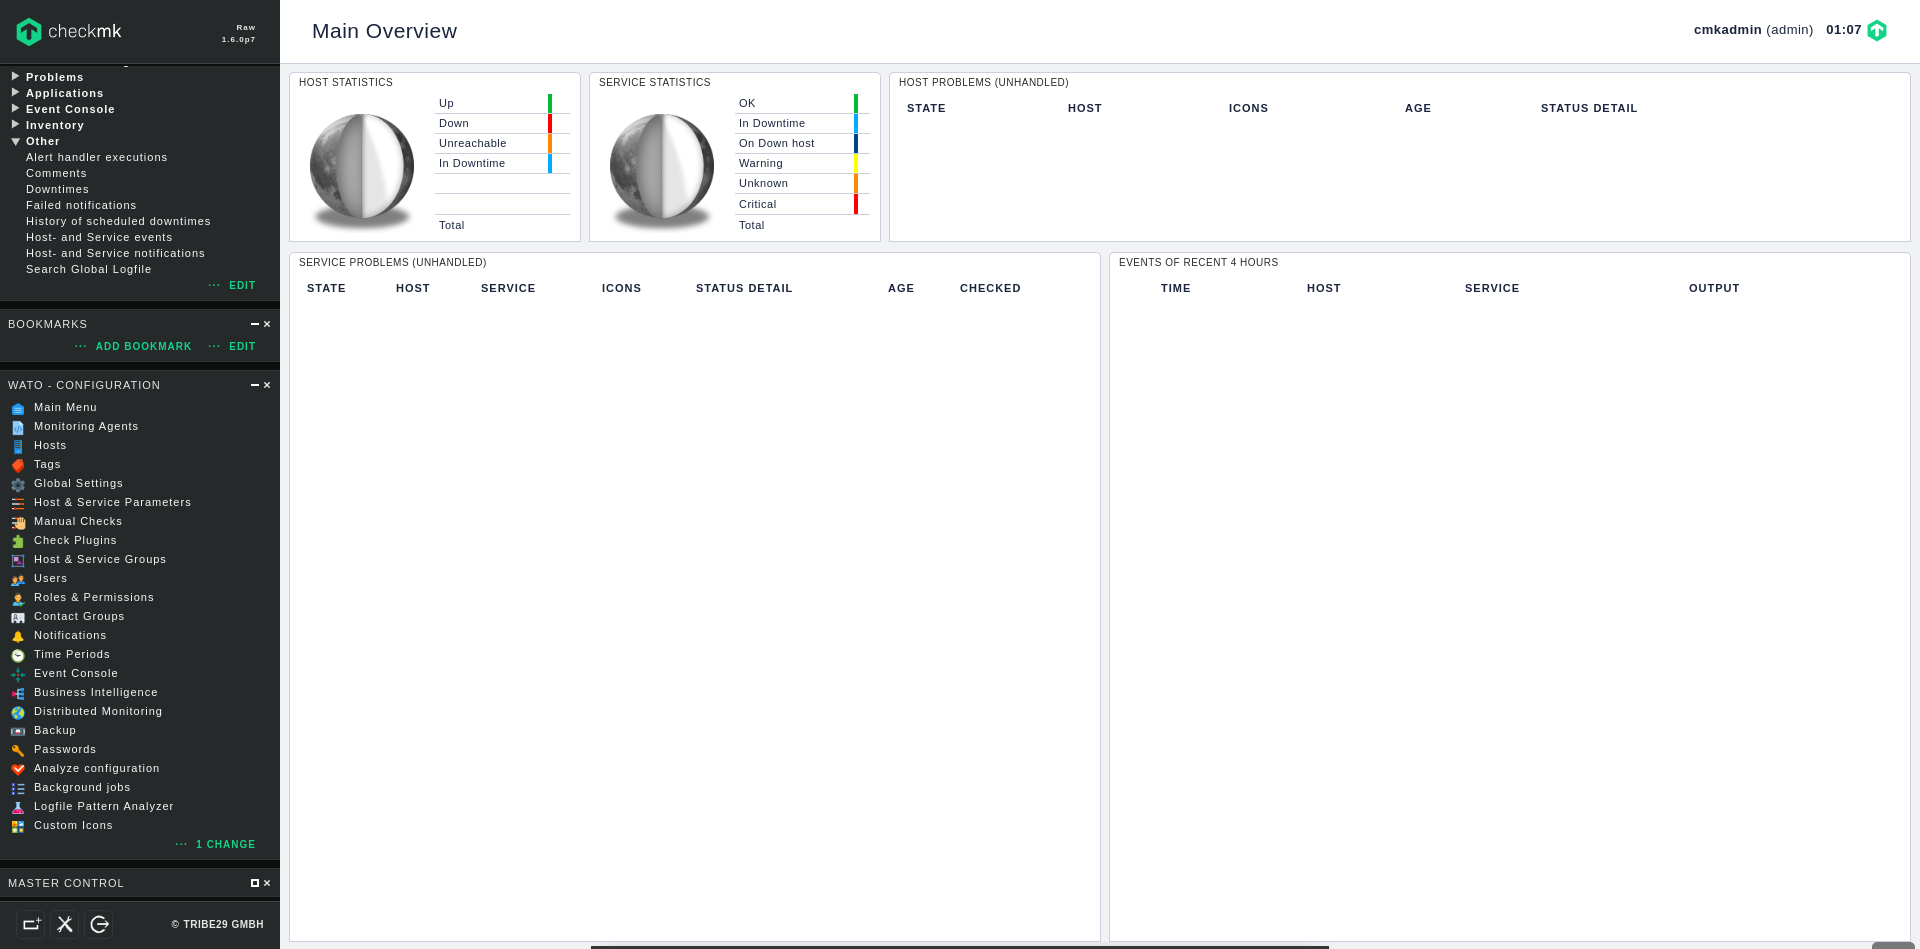
We have successfully installed checkmk server.
checkmk can communicate with the monitored hosts using SNMP protocol, however it’s faster and more convenient to use special agent, called checkmk agent to communicate with the server.
Moreover, the tool comes out of the box with the packaged agent software in RPM and DEB formats for RHEL and Debian derived distros, so I am going to use one to setup checkmk agent on my first monitored host, which is Fedora 30 Server edition.
Install checkmk agent on Fedora 30 Server from RPM package
Default Fedora repository includes checkmk agent RPM package, but it’s a bit outdated, so I am going to download newest RPM directly from my checkmk WebGUI.
The packaged agent RPM (and much more) can be found in Monitoring Agents section in WATO – CONFIGURATION menu (left side panel):
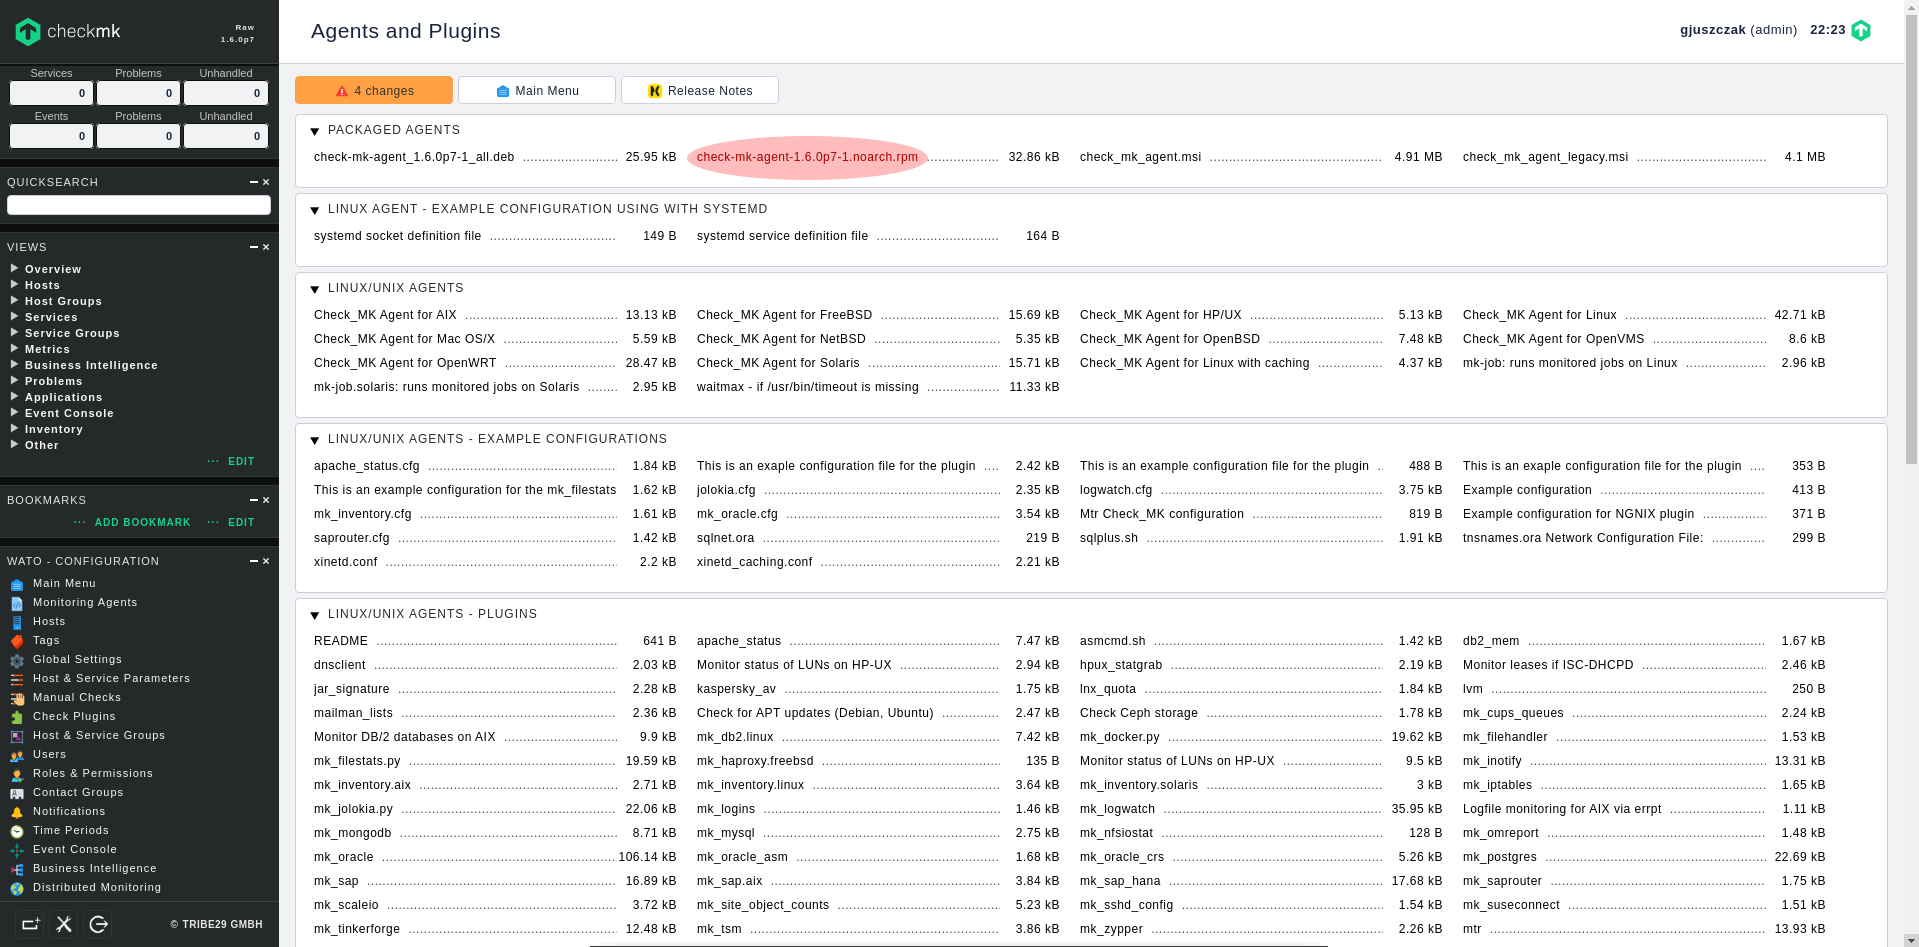
1. Obtain agent RPM directly from your checkmk WebGUI
Log in to your monitored host and download checkmk agent RPM package using wget:
[root@phobos ~]# wget http://check_mk-server-ip/wcss/check_mk/agents/check-mk-agent-1.6.0p7-1.noarch.rpm2. Install checkmk agent from the downloaded RPM
[root@phobos ~]# dnf localinstall check-mk-agent-1.6.0p7-1.noarch.rpm3. Install xinetd server package
To avoid constant resources utilization (CPU, RAM) on monitored host, checkmk agent runs as xinetd service (not as systemd daemon), therefore it needs installed and configured xinetd service on the monitored host.
[root@phobos ~]# dnf install xinetd4. Open port 6556/TCP on firewall
checkmk agent redirects its output using xinetd socket to 6556/TCP port, that’s why we have to open it on firewall (my xinetd interface belongs to a public zone):
[root@phobos xinetd.d]# firewall-cmd --zone public --add-port 6556/tcp --permanent
success
[root@phobos xinetd.d]# firewall-cmd --reload
success
5. Test checkmk agent remote connectivity
Now test the connectivity to the monitored host from checkmk server using simple telnet command:
[root@chronos ~]# telnet phobos 6556 | head -n 10
Trying 192.168.1.1...
Connected to phobos.
Escape character is '^]'.

Version: 1.6.0p7
AgentOS: linux
Hostname: phobos
AgentDirectory: /etc/check_mk
DataDirectory: /var/lib/check_mk_agent
SpoolDirectory: /var/lib/check_mk_agent/spool
Add monitored host to checkmk
1. Create new folder to help classify the monitored hosts
Before we add a new host, it’s good to create new folder to group our monitred hosts. In Hosts section click on Create new folder:
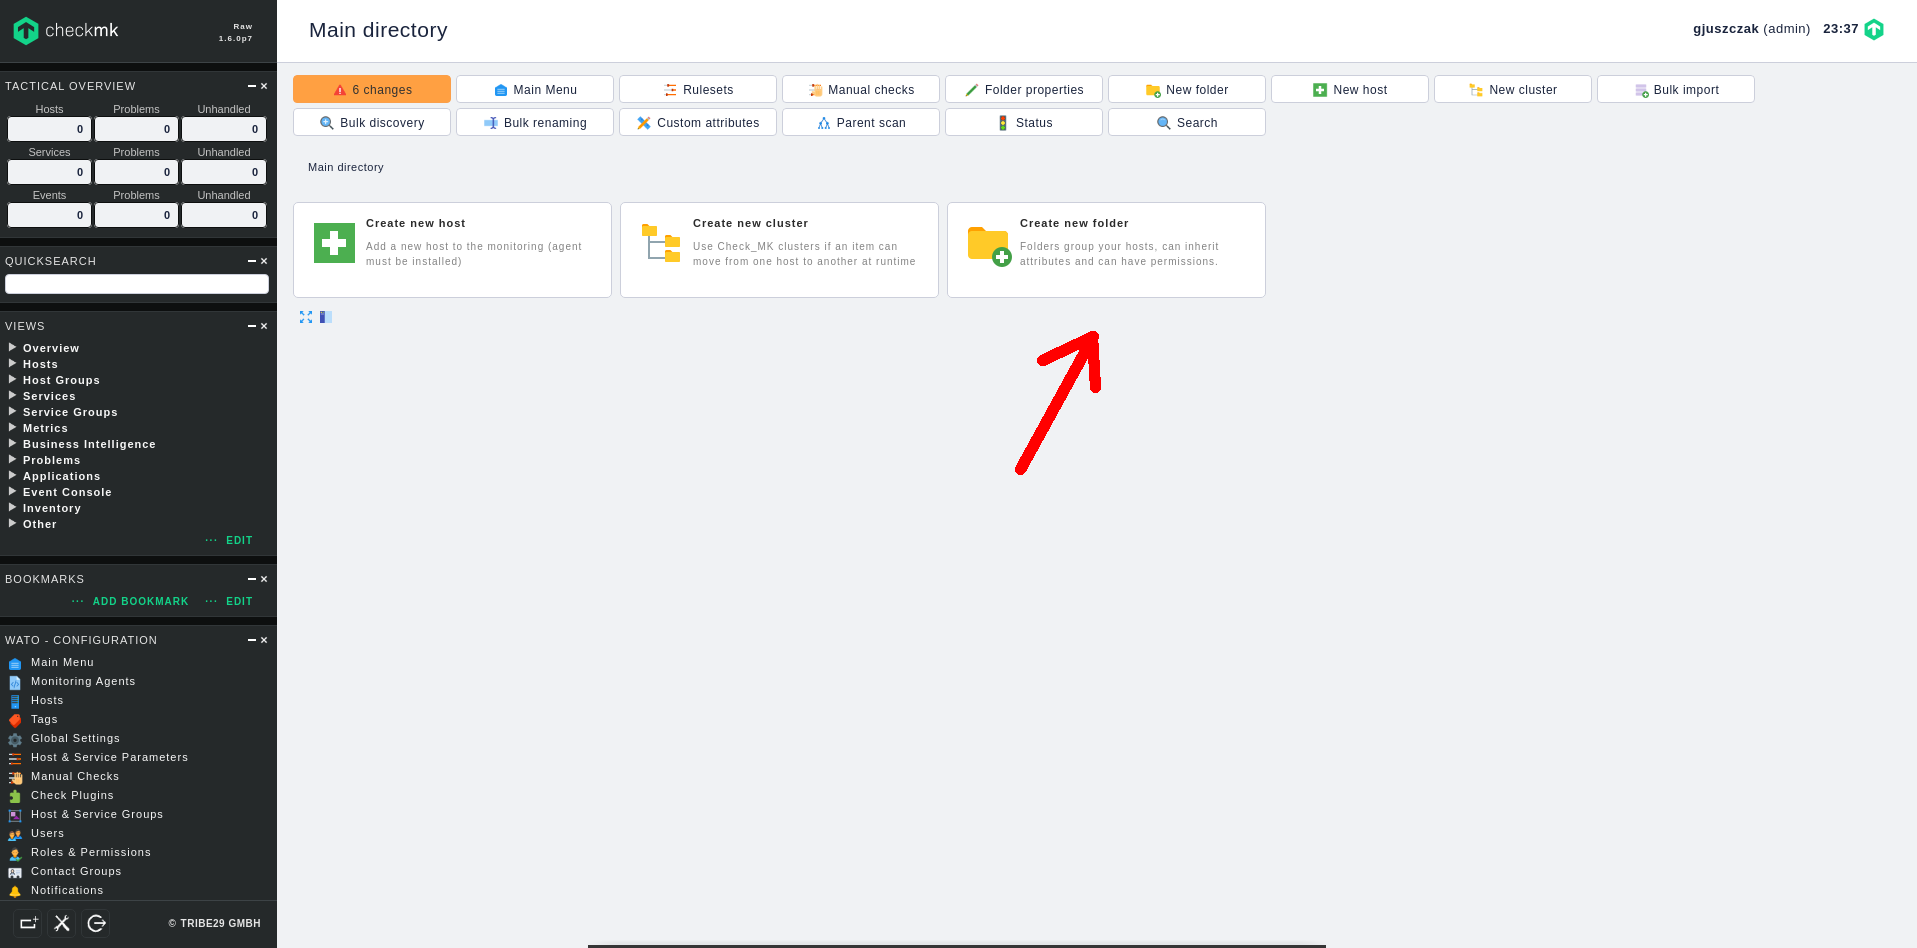
Type at least the Title of new folder. I am creating KVM folder to store here all the VMs running on my KVM Hypervisor.
2. Create monitored host inside the folder
Once the folder is created, go to the KVM folder, then click on Create new host option inside the folder:
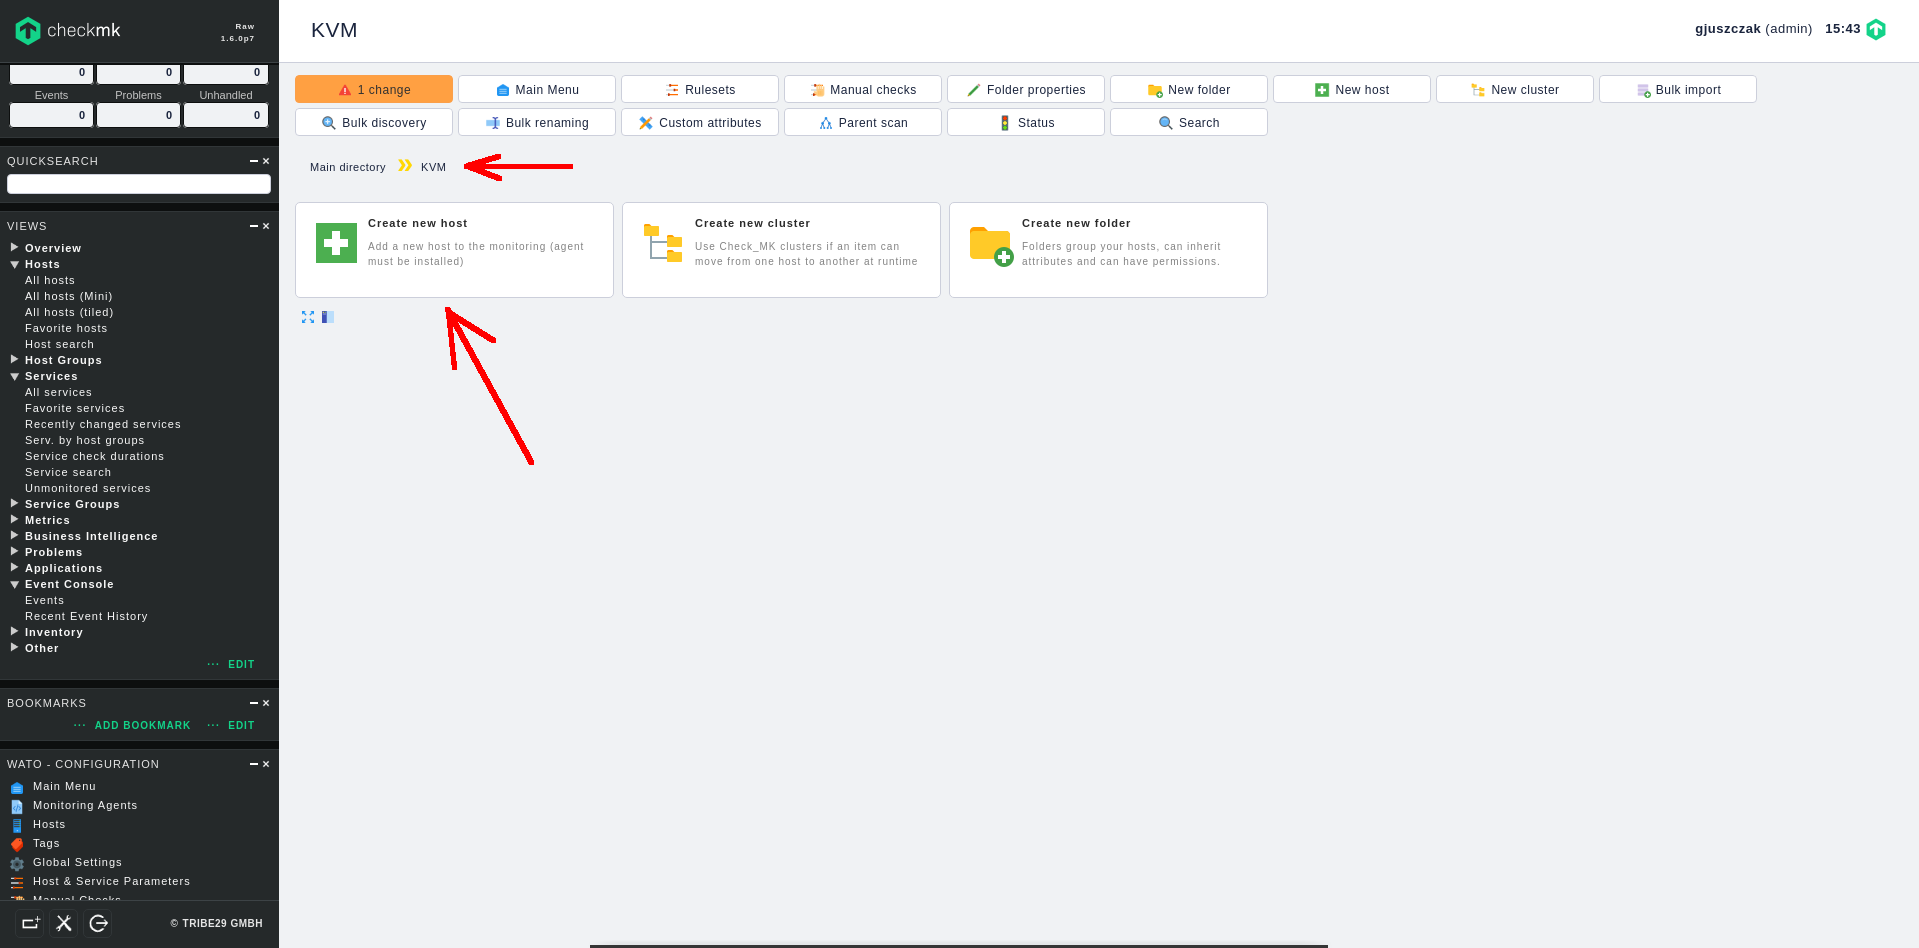
Fill in at least two fields to add new host:
- BASIC SETTINGS -> Hostname
- NETWORK ADDRESS -> IPv4 Address
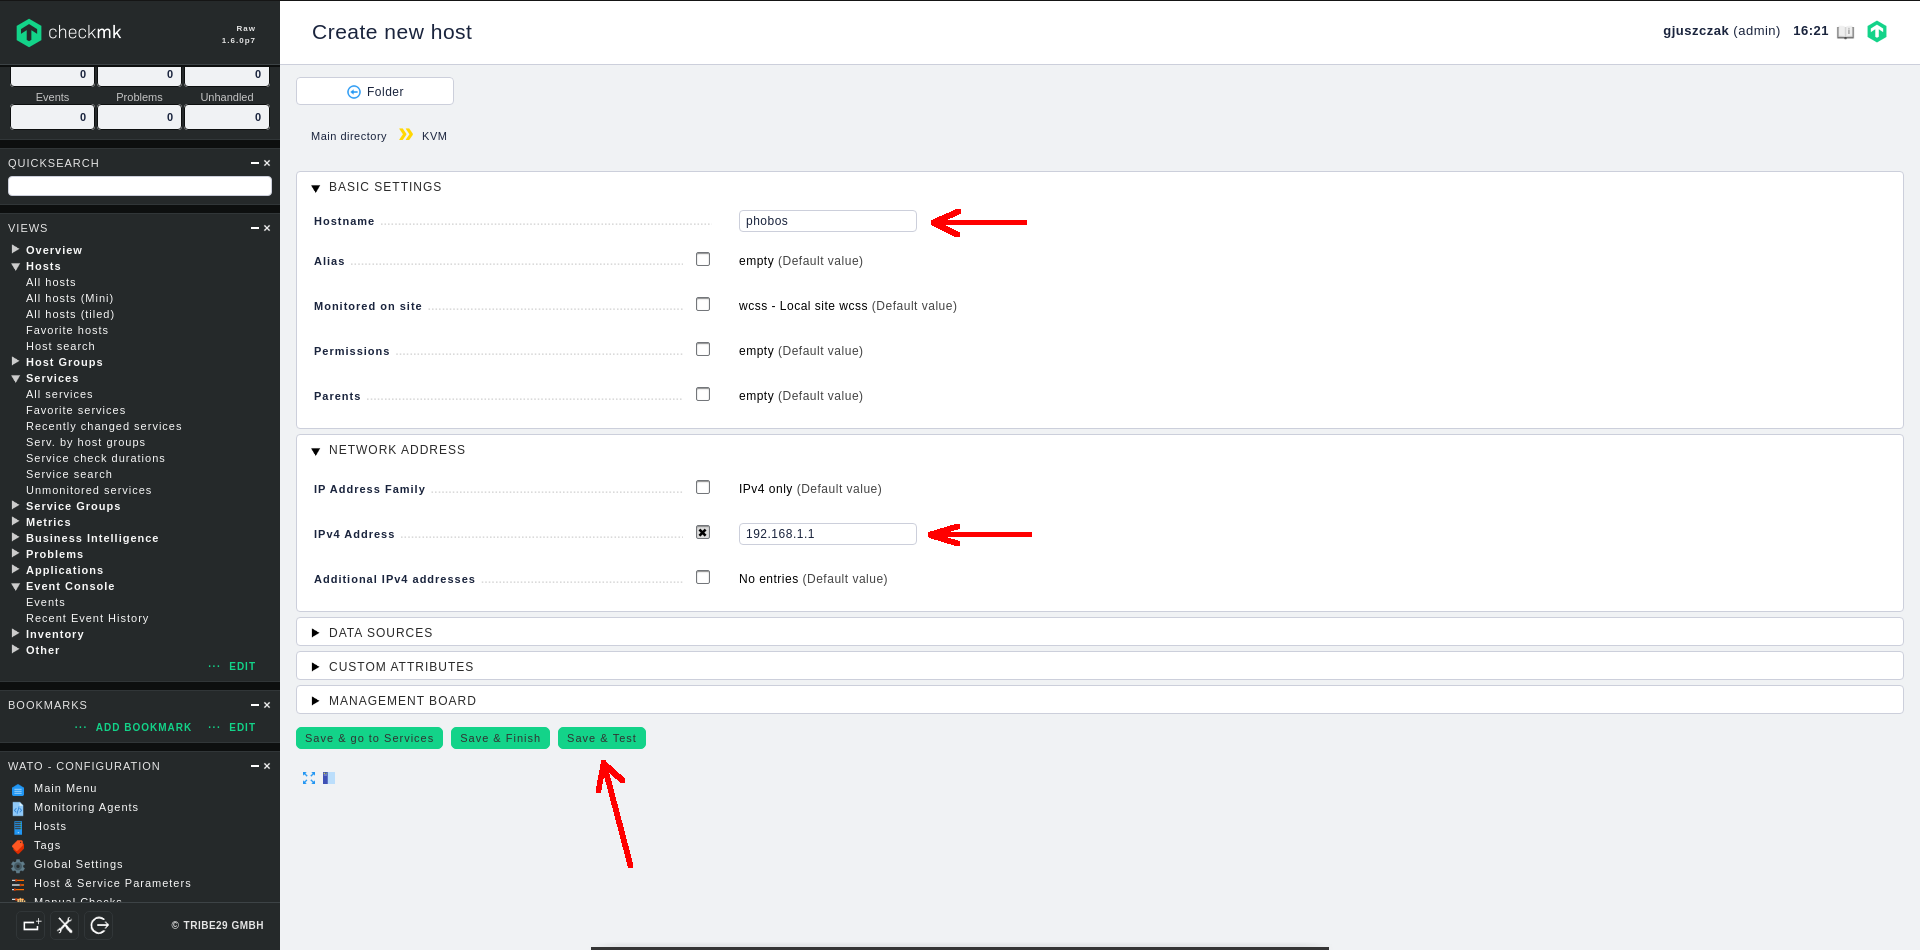
Finally click on Save & Test. checkmk will now try to communicate with the new host using available communication methods, which is checkmk client based communication or standard SNMP protocol.
My new added host uses checkmk client instead of SNMP clients, that’s why only Ping and Agent communication was successfull:
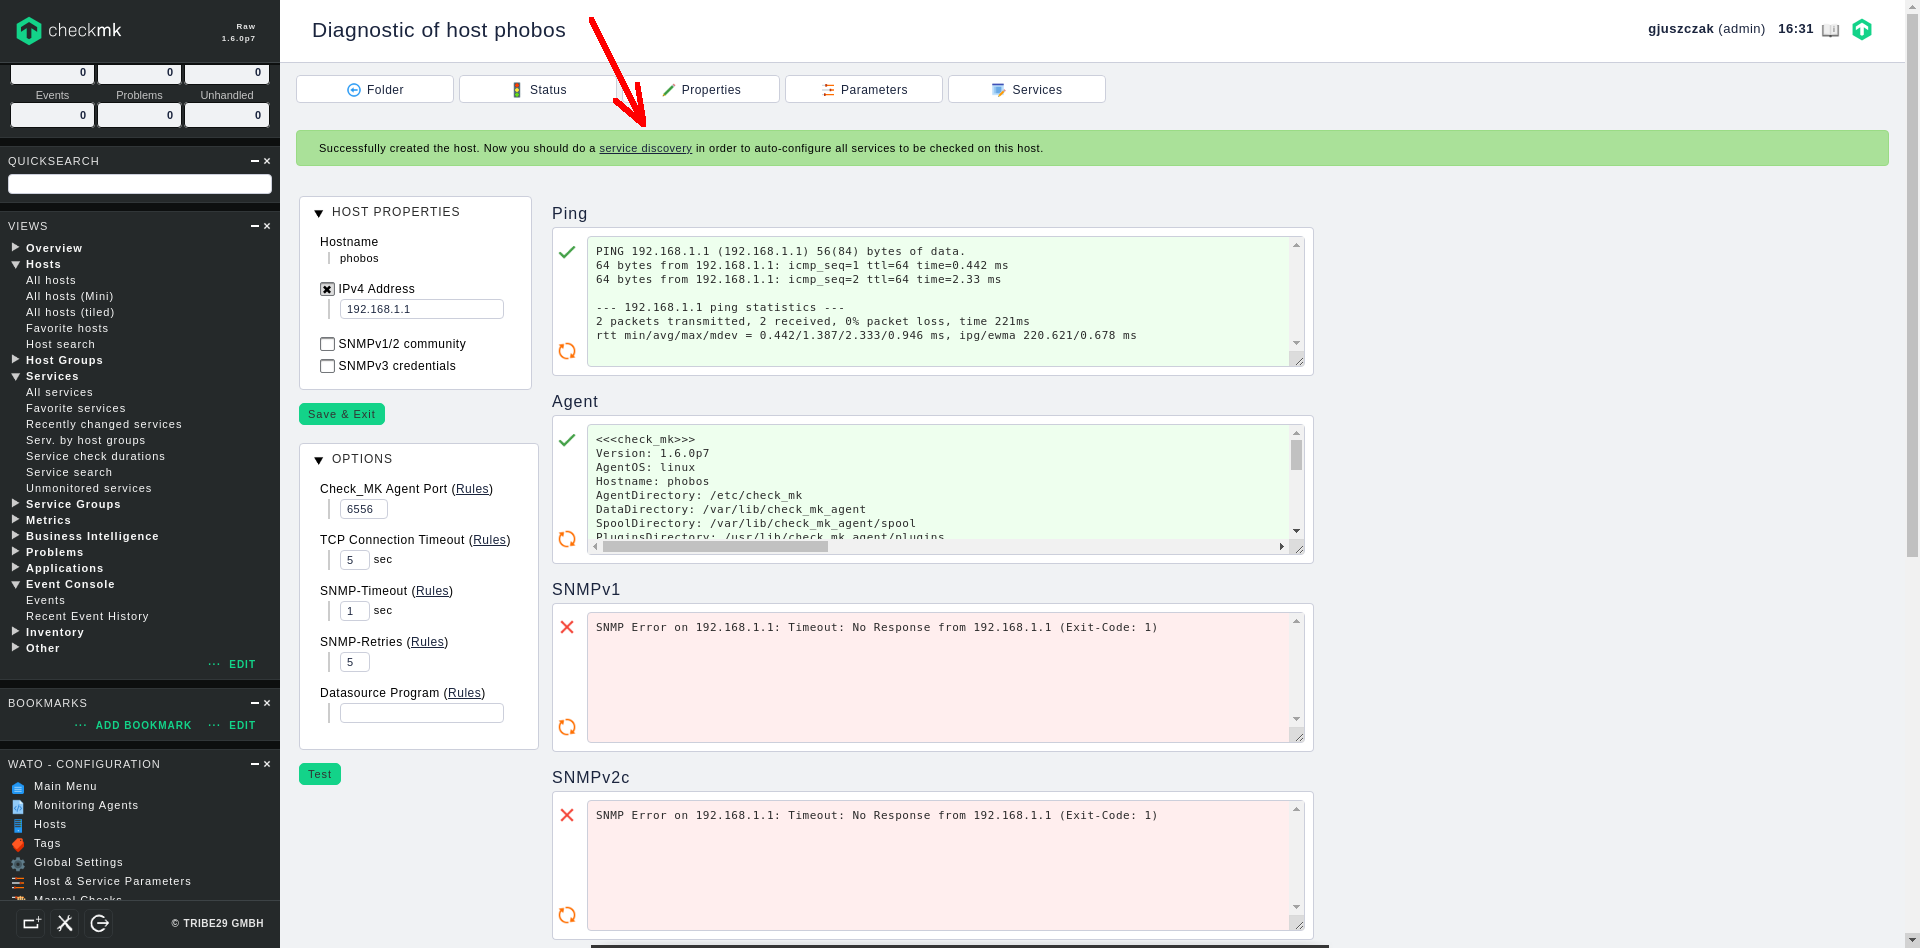
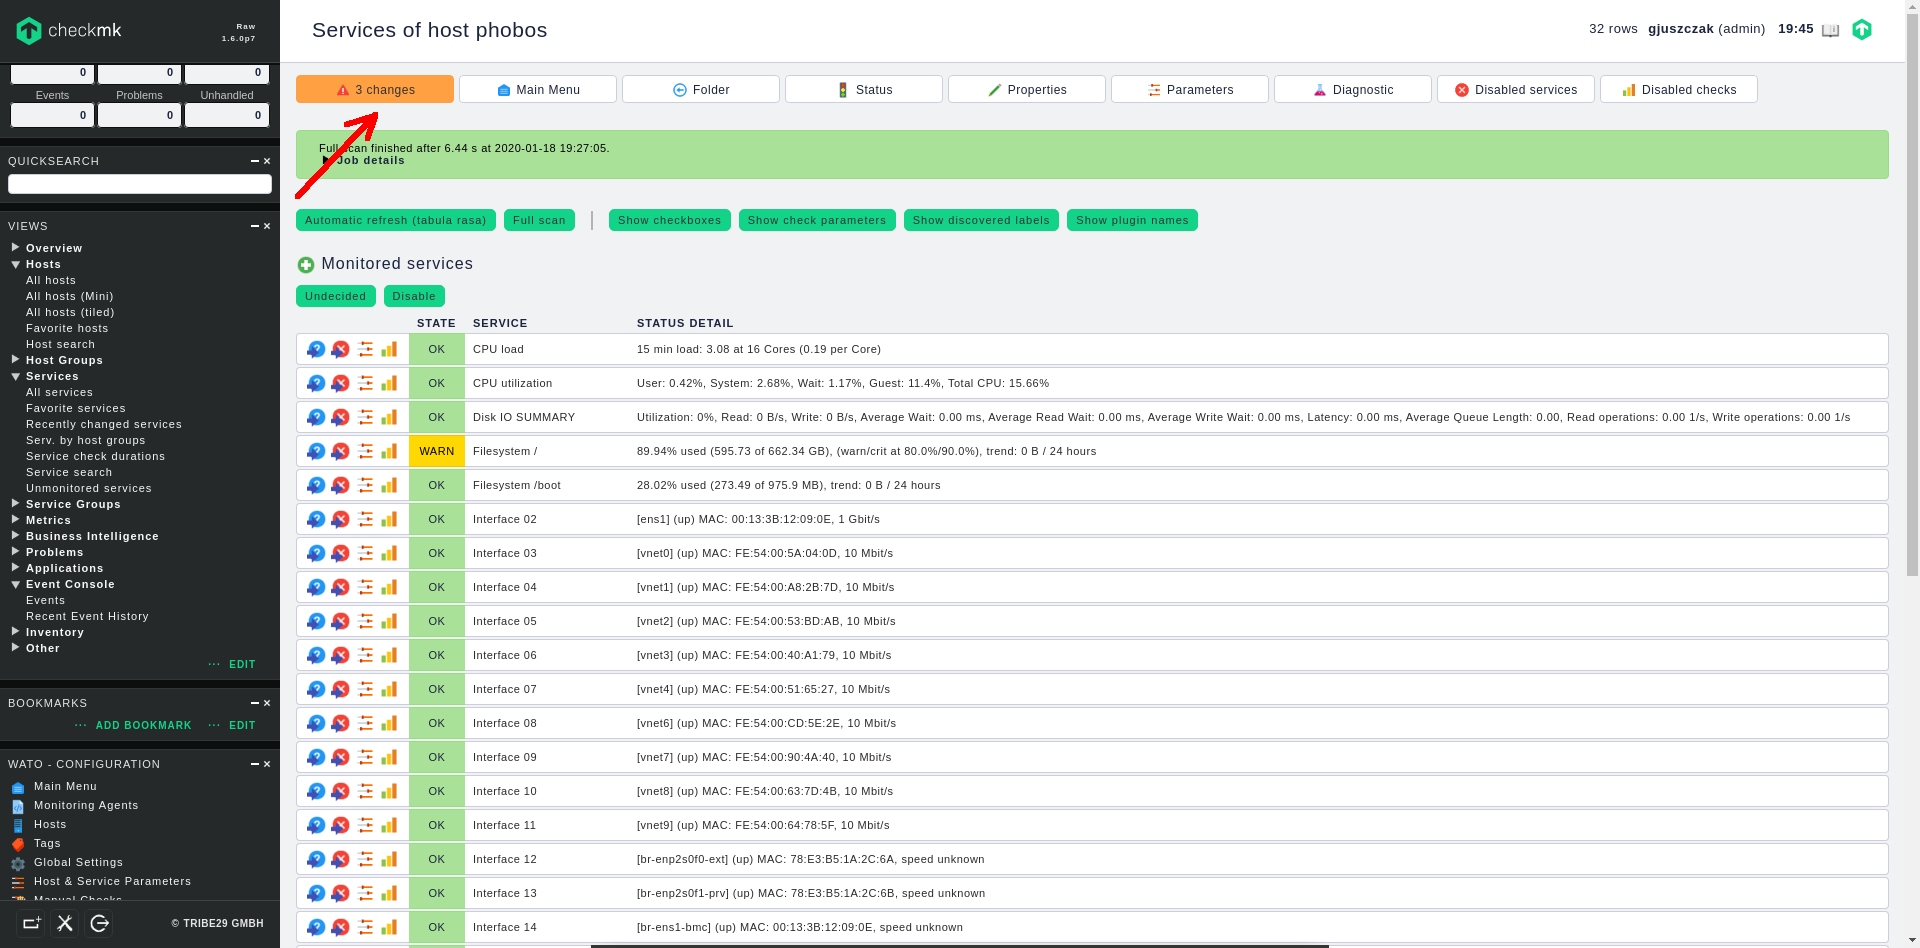
Now click on the service discovery link on the green bar and you will be redirected straigth to the host services screen, where checkmk performs full scan against the available services on the host.
Once the services are discovered, they are still in “undecided” (not monitored) status. You can now switch the required services to the “monitored” status singly or switch them all at once by clinking on the green Monitor button:
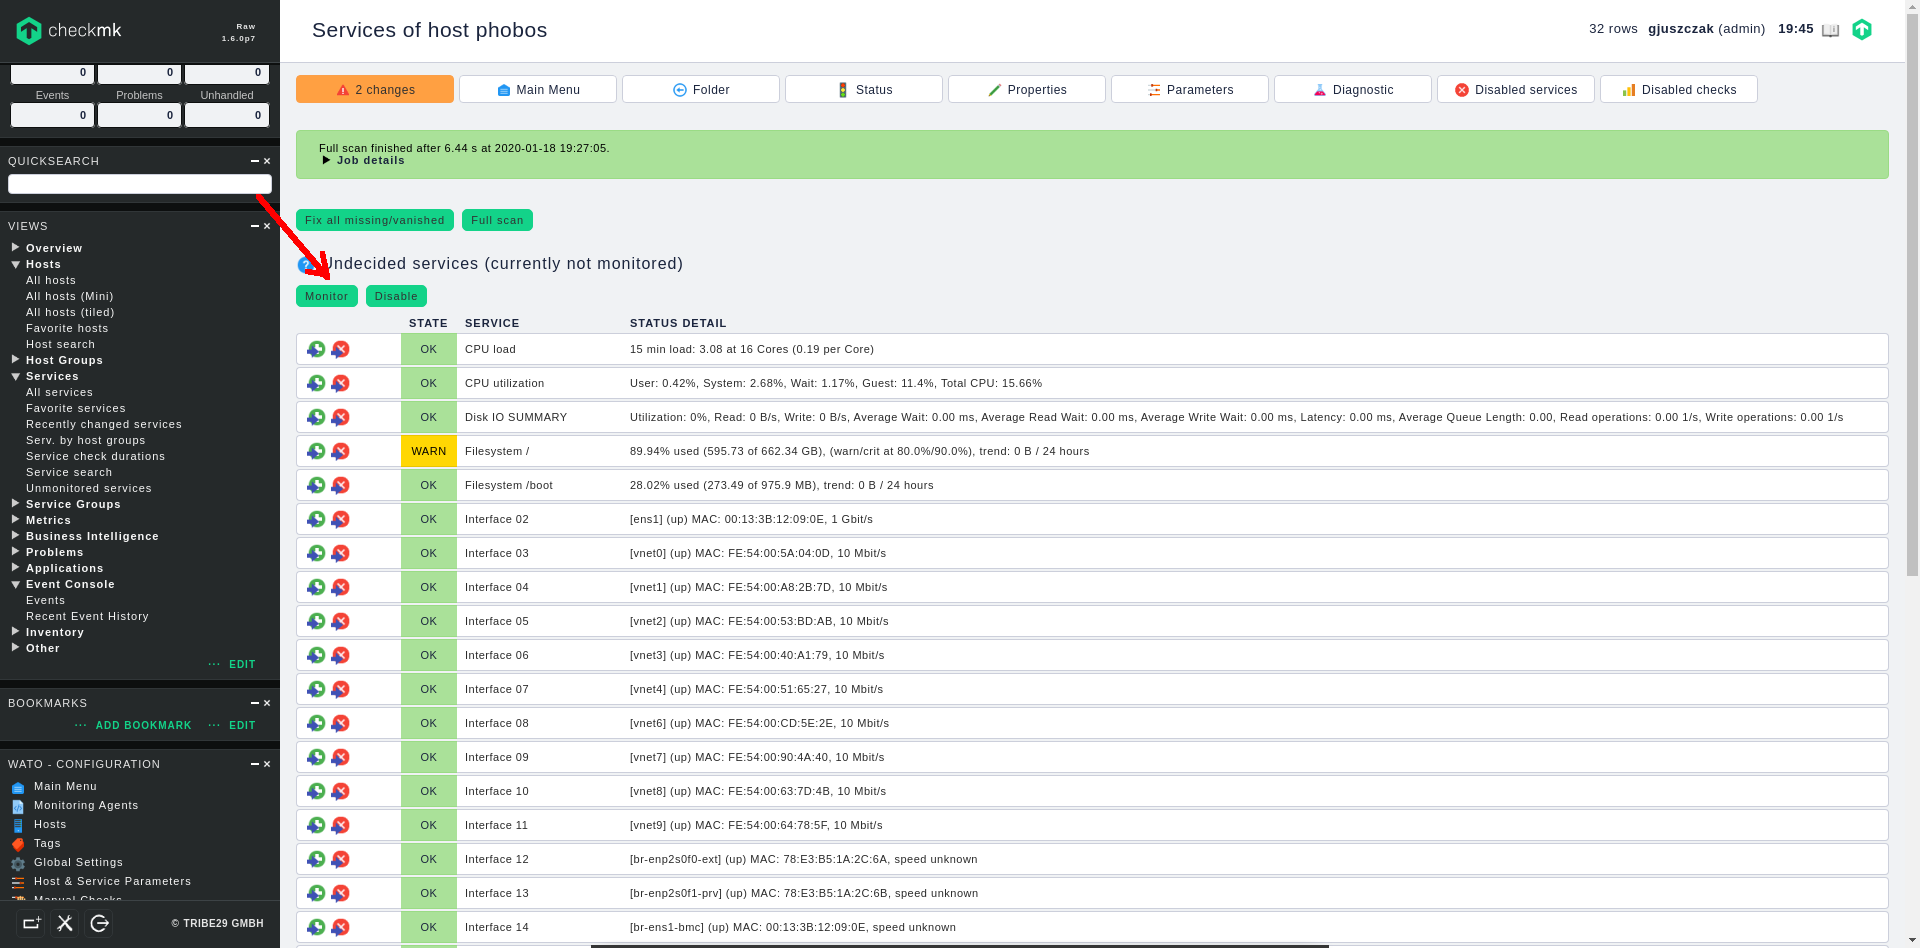
After switching the required services into “monitored” status, click on the changes orange button in the upper left corner to apply all the pending changes we have made so far:
We have successfully added new monitored host to checkmk monitoring system.
Enable rule based e-mail notifications from checkmk server
You can enable checkmk to send out notifications about your host service status changes to your e-mail address in order to get instant notifications in case of potential failures.
IMPORTANT: checkmk does not include SMTP relay mechanism to send out mail, so you have to configure SMTP relay (smart host / null client) on the underlying server, in order to receive e-mail notifications from checkmk. To setup relay host you can use Postfix, Sendmail, Exim or any other software, which can be configured as null client.
On my CentOS 8 based server, where my checkmk instance is running, I have Postfix daemon configured as SMTP relay, here you can find how to install and configure Postfix to send out mail on CentOS 8:
Configure Postfix SMTP Relay on CentOS 8
Here you will find how to install and configure Sendmail as SMTP Relay on CentOS 8:
Configure Sendmail MTA on CentOS 8 to work as SMTP Relay
In the below procedure we are enabling rule based e-mail notifications, which can be used to notify only the particular group of users. This is useful in case a particular host groups affect only a particular user groups and we don’t want to send notification regarding a specific host to all users.
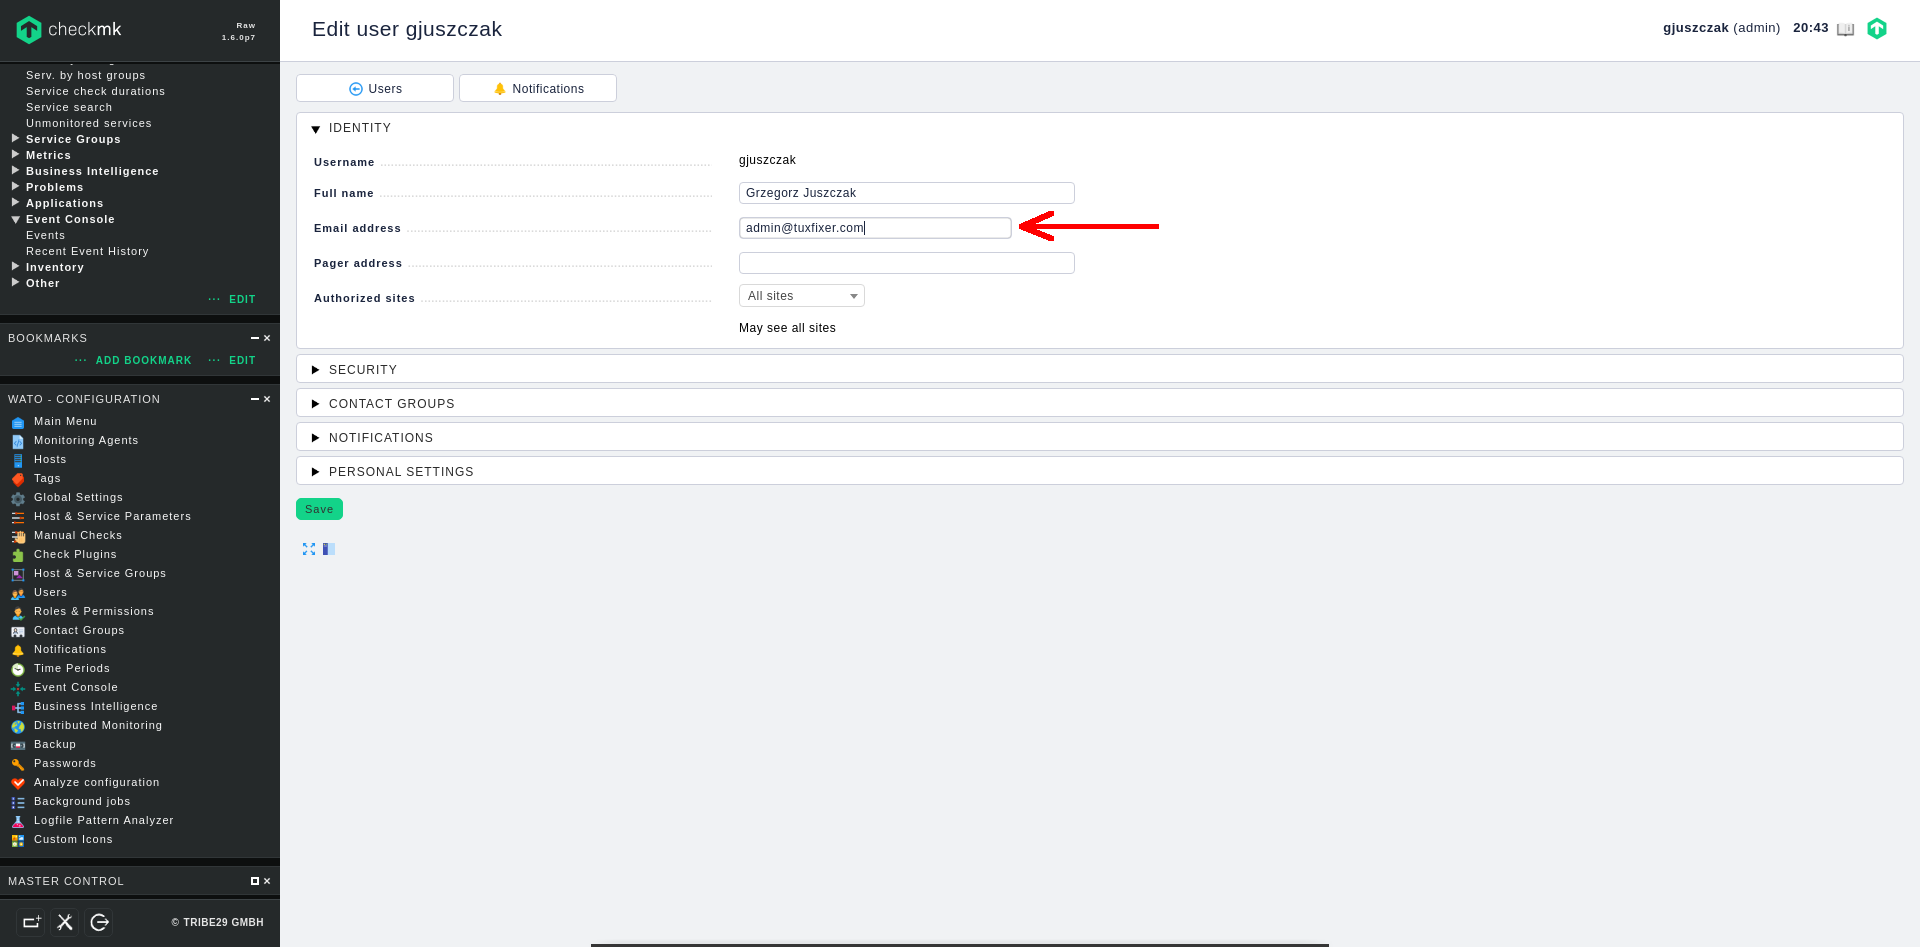
1. Edit user profile
Go to Users section in left panel menu, edit your user profile and make sure you have a valid e-mail address configured:
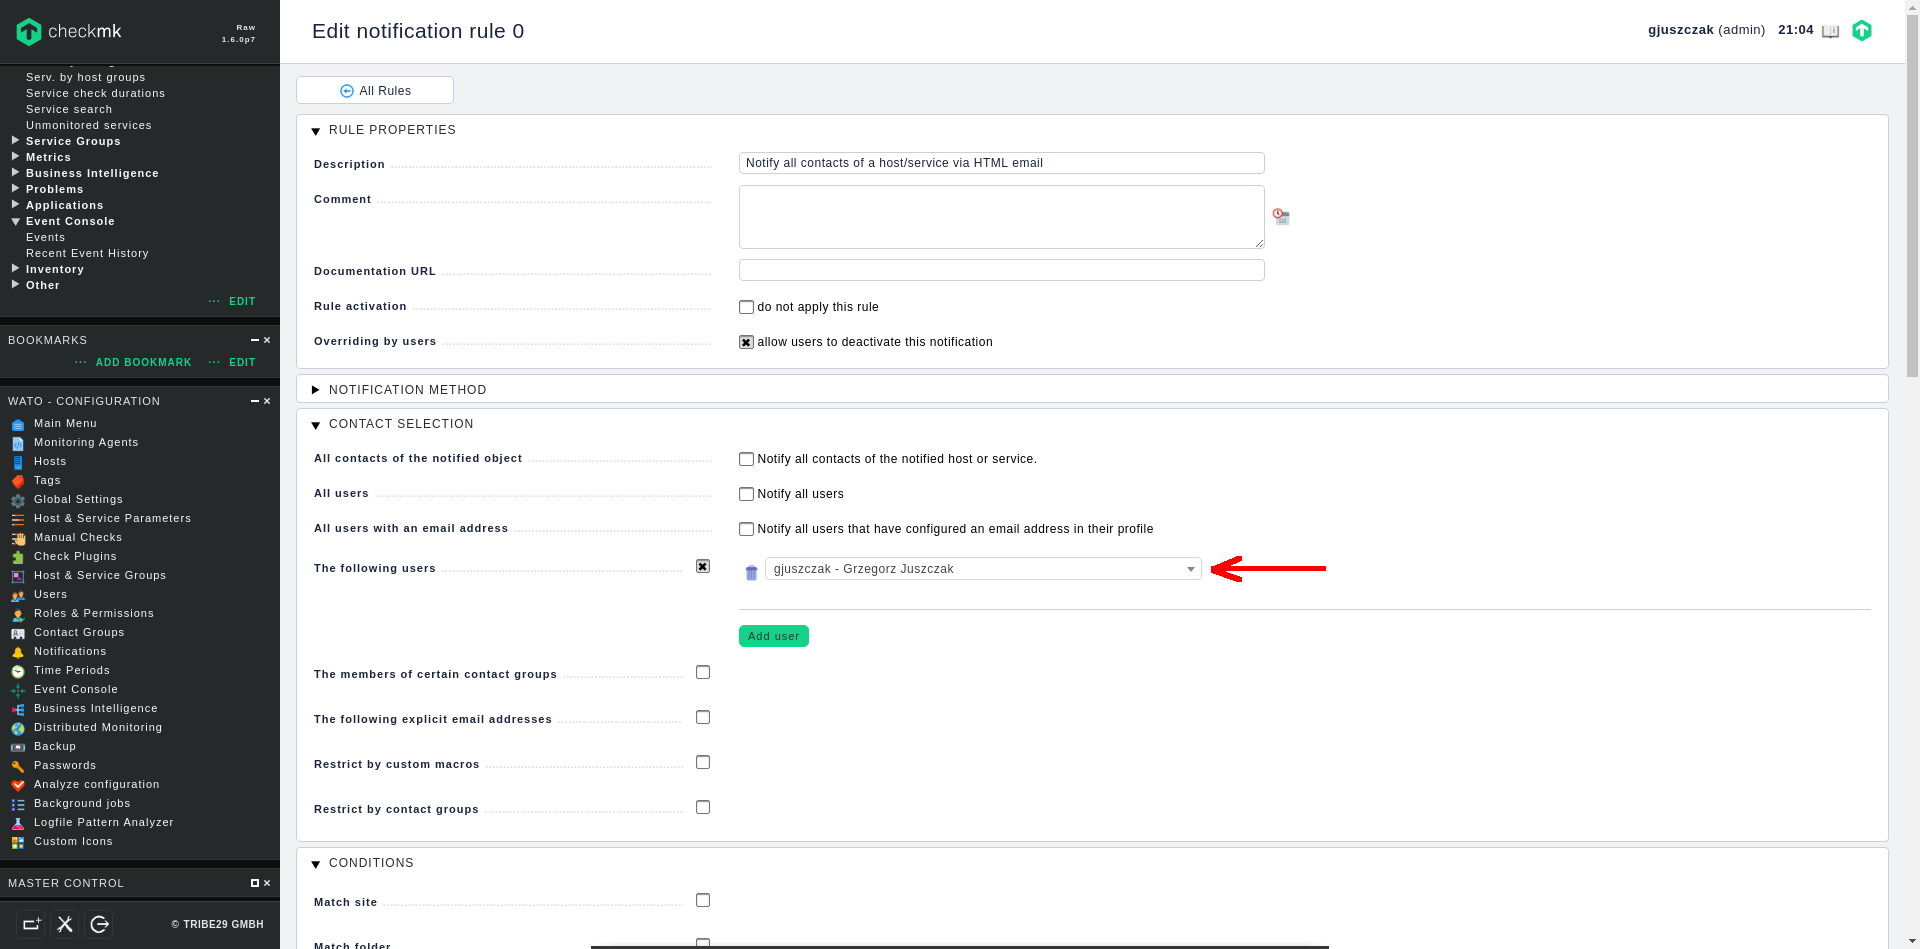
2. Edit notification rule
Go to Notifications section in left panel menu, there is already a predefined rule so I am going to mofify the existing one, but you can of course create a new one if required.
Edit the rule and add the required users in CONTACT SELECTION section to let them receive the notifications :
Next, match host event types in CONDITIONS section according to your preferences:
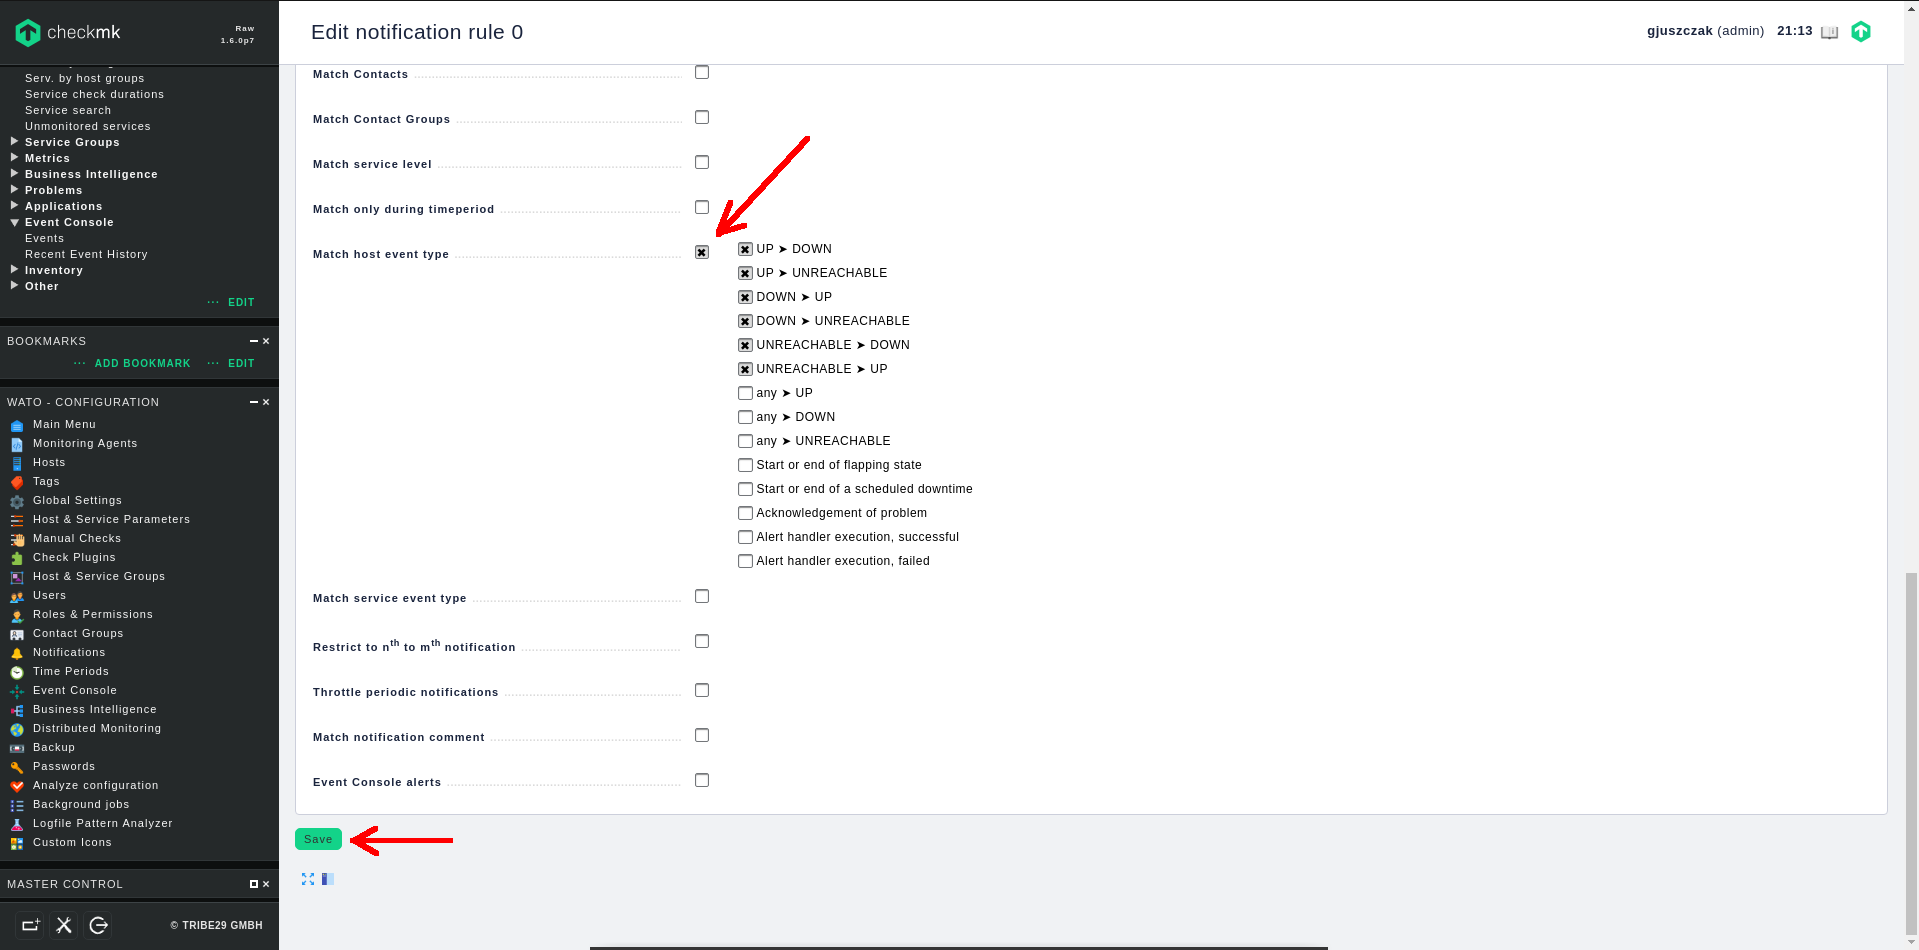
Finally, click on Save button.
Don’t forget to click on the Change orange button in upper left corner to apply pending changes.
Note: in rule based scenario when the critical notification appears and there is no rule to handle it, no one will be notified via e-mail, make sure the notification rules are created correctly including all affected users. Another way to avoid misconfigured notification rules is to configure fallback e-mail address.
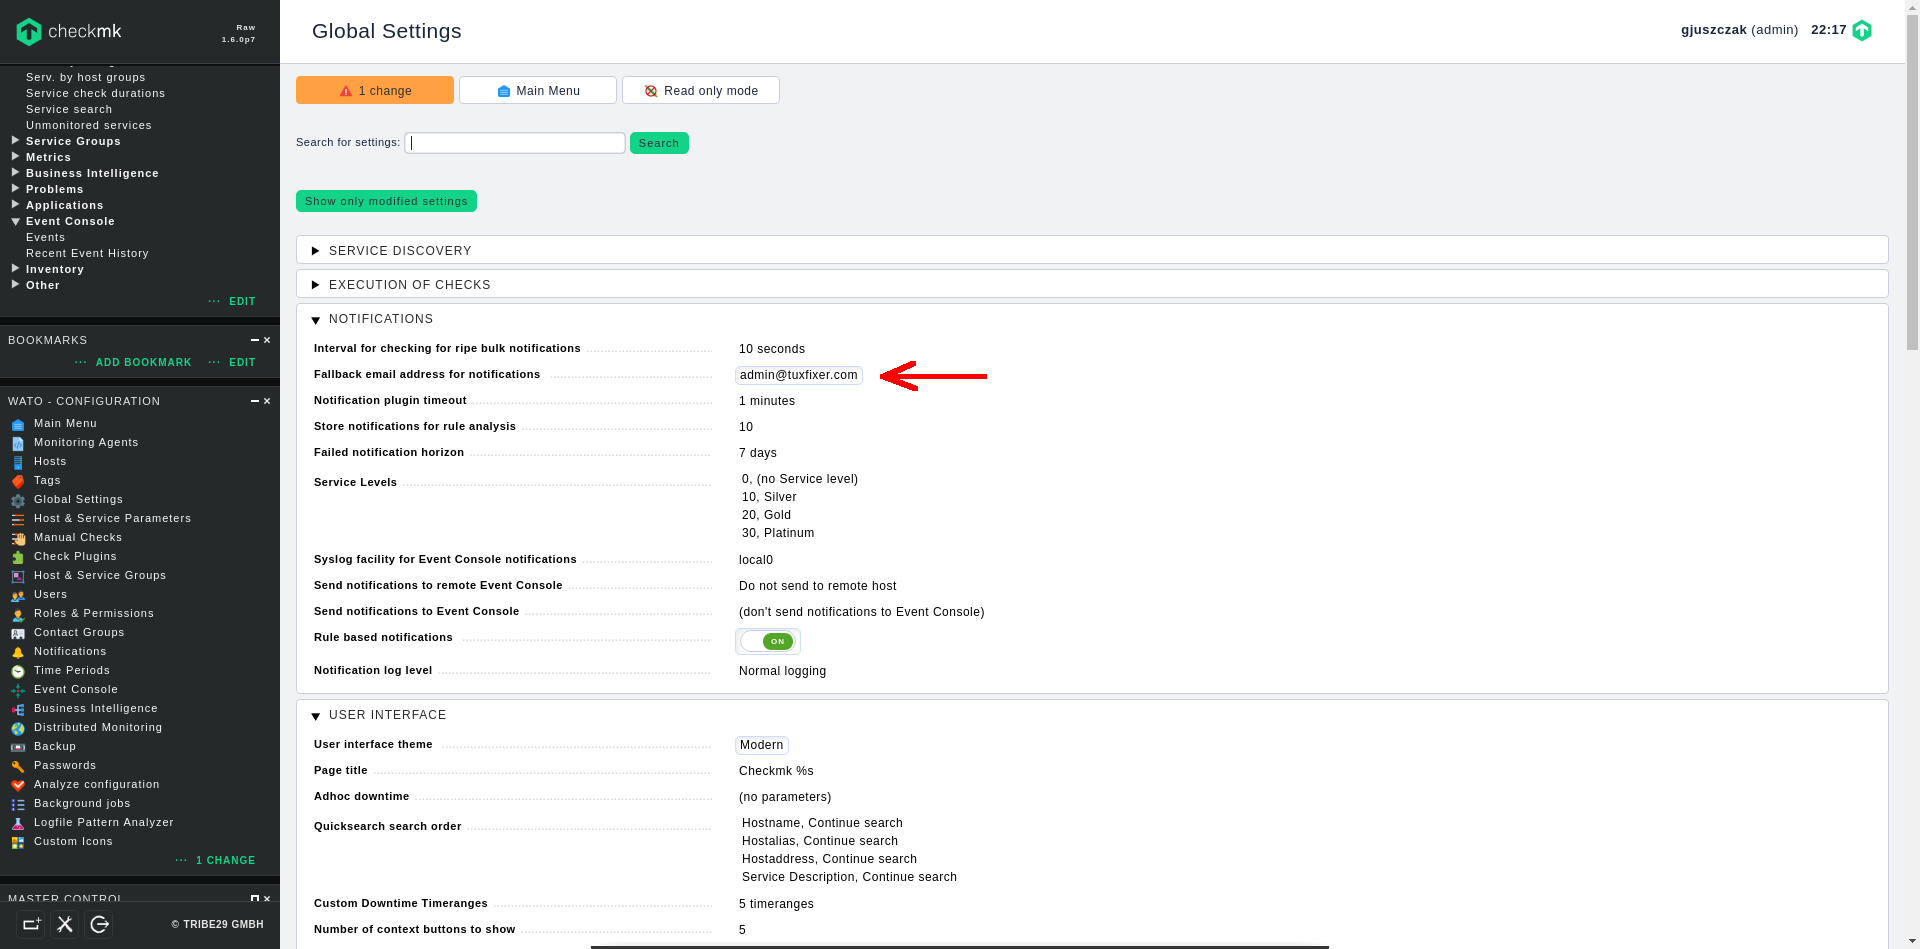
Configure fallback e-mail address for notifications
If you already have rule based notifications configured, it is safe to configure a fallback e-mail address in case, a notification will not match available rules.
Go to the Global Settings menu in left panel and enter the fallback e-mail address for notifications in the NOTIFICATIONS section:
Again, don’t forget to click on the Change orange button in upper left corner to apply pending changes.
Thank you Grzegorz for your work,
Did you happen to find how to temporarily disable the notification for the specific service on the specific host?
If you had your background coming form Nagios you may recall what I mean. Say you do some maintenance on the server where you want to disable alerts sent when one of its monitored services are under maintenance. CHECKMK RAW edition states it is built with Nagios, and when I start the site it looks like it exist,
[root@checkmkraw conf.d]# omd start
Doing ‘start’ on site mysite:
Starting mkeventd…OK
Starting rrdcached…OK
Starting npcd…OK
Starting nagios…OK
Starting apache…OK
Initializing Crontab…OK
Yet I could not to bring Nagios console while CHECKMK does let me start as a separate browser consoles PNP4Nagios, or Nagvis. I expected to still have Nagios console as it was in previous OMD version, where in Nagios I could easily disable alerts per server, or acknowledge the issue temporarily.
If you happen to read my reply and have your answer I appreciate your help.